Many thanks to CIO Review magazine for publishing my thoughts on product validation.
http://www.cioreview.com/cxoinsight/Determining-Product-Effectiveness-When-Measurement-is-Difficult-nid-1160-cid-6.html
[efsthumbnail sdsd src=”http://localhost:8888/davidberzin/wp-content/uploads/2015/01/CIO-Review.jpeg”]
Understanding the efficacy and validity of a digital product is infinitely easier today than during the pre-internet days of shipping software on floppy discs. But, despite the huge advantages conferred by modern analytic systems, many challenges still remain, and as it turns out rolling up your sleeves and getting dirty with a combination of high- and low-fi tactics can get you closer to the answers you need.
“In a perfect world, we would create an analytics system that connects all of the disparate internal and external data sets, from all TV fans to the individualized TV tune-in history of the same users, we’re working it”
Today, online measurement systems like Google Analytics and Adobe Analytics provide product managers and marketers with real time data points from across the globe, consolidated into easy to view and share dashboards with emboldened Key Performance Indicators (KPI), such as per user average “revenue”, “time spent”, “video ad star ts”, “registrations”, etc.
But what happens when your real KPI transcends the online world or is quantified by digital systems that you cannot access or control? That is often the case, where dominant revenue streams remain closely tied to television viewership. This is where product validation gets interesting.
While television rating measurement has been serviced for years by companies like Nielsen, the fidelity that these linear TV measurements offer sales in comparison to modern online analytics systems. This is usually due to very small audience sample size and the fact that these ratings do not connect the dots between drivers of audience interest and the actual television tune-in events being captured.
For example, Nielsen’s core product samples 20,000 opt-in households, requires household members to self- identify themselves via a small tabletop box and is just now beginning to tackle issues related to multi-device viewing on phones, tablets, gaming consoles and other emerging mediums. In other words, Nielsen shows you a very thin slice of the pie.
As a product development lead, my validation tasks are further complicated by the nature of my particular area of focus, social products, which specifically includes both on-site user activity (commenting, voting and sharing) and off-site behaviors on social networks that have little or nascent measurement systems. So how do you measure the un- measurable? Here are three ways to tackle this particular beast, based on what we’ve learned equating user social behavior to television tune-in:
1. Connect the Data and Run the Numbers
This one may sound obvious, but it is typically very difficult to achieve. In a perfect world, we would create an analytics system that connects all of the disparate internal and external data sets, from the public and private social actions of all TV fans to the individualized TV tune-in history of the same users. This is a tremendous challenge due to the scale of both social activity and television viewership, not to mention the litany of players on both sides of the television content.
That said, this data access is the holy grail and is worth pursuing. At this company, we’ve done some remarkable things to connect the un-connectable and it’s been invaluable to our strategic and tactical business decision-making process.
2. Break the User Path into Bite-Sized Pieces
While end-to-end – or should I say Tweet- to-remote – data analysis is a huge task, you can still derive tremendous product insights by taking validation one piece at a time. For example: What social factors best lead to television viewership? This is a ball of string with many starting points but folks are beginning to find insights.
Last year Nielsen and Twitter connected Tweets with actual Nielsen ratings and announced a causal relationship between tweets about TV viewing. Even though the research details revealed that the effect was limited to 29 percent of shows, it was a step in the right direction. And while Twitter is only one social network of many, they are particularly chirpy when it relates to social and TV.
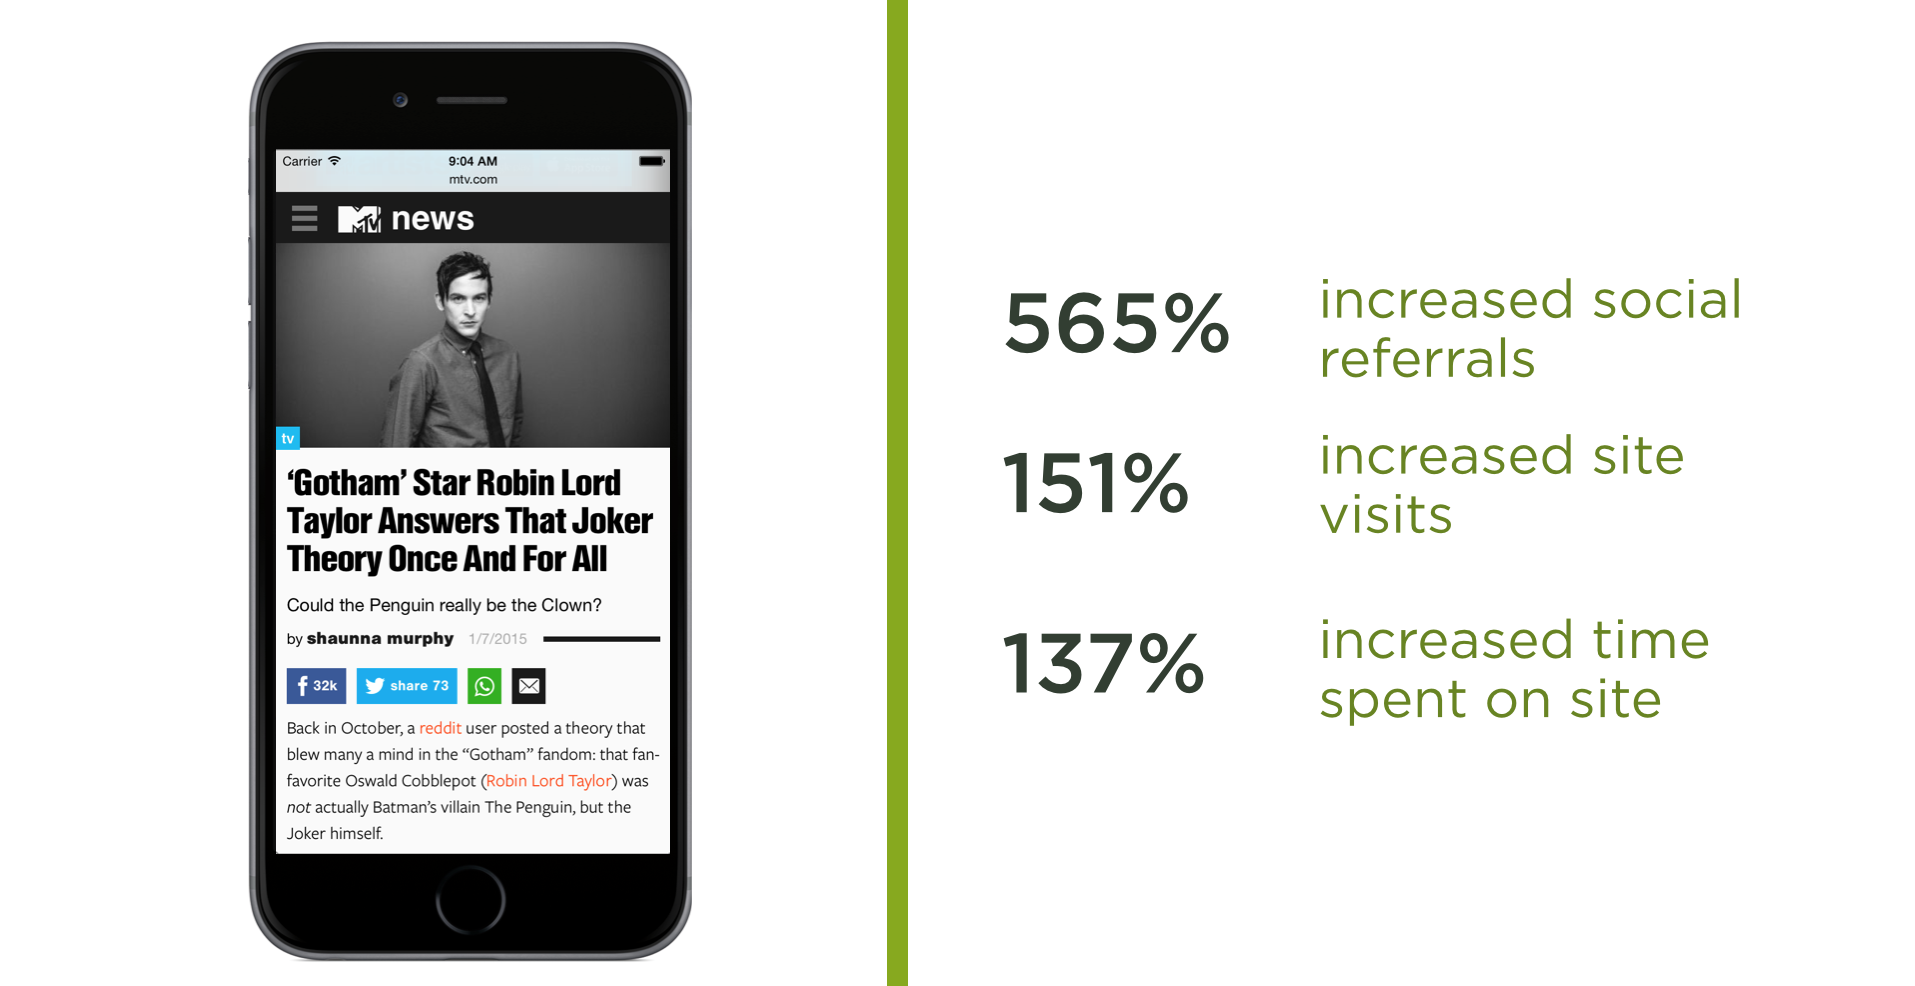
Another example of bite-sized measurement: What online events lead a user to take a social action? At Viacom we can track many of the social events that originate from our digital properties using modern quantitative analytics packages. These packages offer great scale and we can split-test audience segments to prove our ideas are valid. That said, off-property social events dominate the social fire-hoses, so there, our visibility is limited.
3. Talk to Users
Qualitative conversations with your customers and users is absolutely invaluable. As the best modern product development methodologies point out, you are not the user. Instead, you are a biased business stakeholder that is likely too deeply invested in the idea to give it an impartial valuation. Share your ideas with end users early in a straight-forward, non-leading way. Design thinkers recommend using low-fi physical prototypes that are literally stuck together with scotch tape and pipe cleaners. These interactive and tangible representations of your best ideas often generate quick ah- ha moments, especially when they are miss- (or perhaps correctly?) interpreted by the end user.
In my experience, the most important goal of working directly with the end user is not getting them to immediately prove out your idea as valuable. Instead, working with users allows you to quickly sift through many different ideas, some good, some bad, some biased, some pure, some half baked, and some ready for prime-time.Sorting the wheat from chaff early allows more time for steady incremental revisions of the better ideas.
OK, so there are gaps in the data and the end-all solution is still a ways off. But by creating dots of intelligence you can begin to draw lines. Following where these lines lead builds better products that create value for both your organization and end users, and that’s validating. In a perfect world, we would create an analytics system that connects all of the disparate internal and external data sets, from all TV fans to the individualized TV tune-in history of the same users, we’re working it.