Goldilocks Criteria: Customer Data Platforms

This is the second in a series of posts designed to help managers think about business requirements for selecting enterprise vendors and software.  Please also check out my first post on Business Intelligence platforms.

Customer Data Platforms (CDPs) inspire a lot of confusion.  Best to begin with what they are and what they are not.

CDPs are:

  • A centralized platform for storing all of the user data about all of your users
  • A platform that can be used by non technical employees to activate / action upon user data
  • An safe-haven for secure user data management, compliant with the latest regulations and best practices
  • A bridge to combine your user data with external data sets
  • A rules engine for user segment management.  Want to build cohorts of users who opened an email and clicked on a Facebook ad – no problem
  • A platform for collaboration, breaking down individual business unit data silos

CDPs are not:

  • CRM solutions designed for sales or support teams to manage intricate customer interactions and workflows
  • DMP solutions focused only on anonymous cookied / IDed users (though they are coming close to covering this feature set)
  • Tag Management solutions designed to wire up various vendor libraries and SDKs.  Many CDPs were Tag Managers, but I think the historic focus on tag management is a disadvantage to be a best of breed CDP.  Just because you were a horse, it doesn’t make you a better car

And why do people integrate Customer Data Platforms?  Centralizing user data, strengthening the intelligence around it, and democratizing access to use it should impact business goals across the board from decreases systems costs to improved conversion rates.

The basic ins and outs of a CDP.

Given all of this, let’s review my Goldilocks (“just right”) criteria for picking a Customer Data Platform:

Connectivity and I/O

Customer Data Platforms are only as good as the pipes that bring data in and out of them.  You want many different roads into the platform from plug and play SDKs / libraries to full read / write APIs.  You also want pre built connectors into the most popular data sources (CRM, event ticketing platforms, etc) and data activation endpoints (ad networks, social media channels, email service providers, etc).

Security and Compliance

As we’ve learned over and over recently, user data security and governance is no easy tasks.  Outsourcing this to a vendor may be a hard decision to make, but it’s often much harder managing and maintaining secure and compliant user data solutions internally.  You want a partner with a tract record of secure data management, comparable customers that you trust and no fear of security audits from your team or others. You also want a partner that is quick to update to changing industry rules and regulations (ex. GDPR).  Internally, you want robust rules, roles and permission settings to partition off sensitive data for specific users and use cases.

Administrative Usability

CDPs are designed to democratize data-driven activities for non-technical users.  As such, you should require a modern, usable UX for non-engineers to get busy with the data.  Some providers require light scripting for segment creation or segment activation. No good. Best to trail the administrative user experience with some of your least technical colleagues before pulling the trigger on a vendor solution.

Identity Management and Identity Resolution

There are a number of features in this functionality bucket, but in short, you want your CDP to consolidate literally all of your available user data into a singular user profile.  This might mean partnering with a device or identity-graph provider to stitch emails to cookies.

This also means flexible data storage limits so that you don’t have to discard potentially valuable user data limits.  At Viacom, a certain % of the US population visits our sites / websites or volunteers their email addresses. That said, our TV signals reach the homes and mobile devices of a much larger user base.  We need systems to allow us to pull all of our data together without worry about a vendor’s storage costs or historic architectural limits.

Real Time Segmentation Updates

You user’s profiles and segments should update in real time as they take actions on and offline.  Many CDPs update segments hourly – which is no bueno. If a user views / interacts with your website or an online ad, their profile should update immediately so they can activate to the next event in your funnel.  Many of the CDPs who came from legacy industries (again, Tag Management) are just not architectured to support real time updates. This is of growing importance.

Integrated and Automated Machine Learning

The next generation CDPs go further than data storage and segment storage.  The best support unstructured data and use machine learning to automatically create useful user segments.  Some even crawl and categorize your content (pages, emails, posts) to find interesting patterns and apply those as dynamic segments to your users.  This is the type of thinking you want to see from your Customer Data Platform partners.

The platform should also support custom data science models – whether run internally within the CDP or through easy and performant read / write APIs.

ML fanboy alert – this is one of my very top considerations when reviewing partners.

Smart Orchestration

Getting your users through a funnel from start to conversion is never easy.  Your CDP should monitor and track your progress and where possible add dynamic intelligence to usher users through funnel events and towards your target goal.  The alternative is intricate manual workflow creation and management, which is hard to set up and even harder to manage against other initiatives.

This dynamic orchestration allows for truly personalized, omni-channel user journeys – experiences and messages that change based on the individual user’s profile properties and the best likelihood of conversion.

Industry Momentum

There is a ton of investment in the CDP space right now.  You’ll want to pick a horse with recent major funding from venture capital or a strategic investors.  Many of these companies will not be in business in two year’s time.

-David

Goldilocks Criteria: Selecting Business Intelligence (BI) Platforms

This is first of a new series of posts dedicated to helping people select data tools and infrastructure. I’ve listed out the ‘perfect’ feature set for a dream product. Of course these features rarely exist in a single solution, but if they did, I’d use it! First up: business intelligence platforms.

There are many fiefdoms in the kingdom of data – from product analytics to predictive models to advanced user-facing data applications – and no single platform will address every need. So for the purposes of this discussion, let’s define Business Intelligence platforms as data platforms that non-technical business users to explore, prepare and present data germane to their work. These tools should support data-driven insights and decision making but should not require a STEM degree or General Assembly workshop to operate.

Turns out this is ancient stuff. Business Intelligence (BI) platform date as far back to the ‘60 – the 1860s – when Richard Devens coined the term in his Cyclopædia of commercial and business anecdotes when Devens used the term to describe how Sir Henry Furnese, a banker, gained an advantage over his competitors by using and acting upon the information surrounding him. Over the past few decades BI tools have matured rapidly, shifting from beastly on-premise data warehouses with text-focused UIs to cloud-based, mobile-first, lithe data platforms designed for non-technical users.

https://www.sales-i.com/a-history-of-business-intelligence

BI is defined, generally, as ‘tools for data analysis and report generation on top of data aggregated from multiple disparate systems‘. Some BI platforms sit on top of separate data warehouses, and some modern platforms serve as the data aggregator / data store as well. BI tools pack a ton of functionality, but are typically narrow scoped. You don’t “do” anything within your Business Intelligence platform, instead you investigate, learn and report on how other systems are “doing”. BI surfaces data to guide decisions made elsewhere.

BI is generally defined as ‘tools for data analysis and report generation on top of data aggregated from multiple disparate systems’. Some BI platforms sit on top of separate data warehouses and some modern platforms serve as the data aggregator / data store as well.

BI tools pack a ton of functionality, but are typically narrow scoped. You don’t necessarily “do” anything within your Business Intelligence platform. Instead you investigate, learn and report on how other systems are “doing”. BI surfaces data to guide decisions made elsewhere.

You will also see BI in the form of Embedded Analytics within various tools – like your CRM system or your Web Analytics platform. Generally, Embedded Analytics help steer micro tasks like, which email subject performed best?, vs. providing a holistic view of data across multiple sources. The best BI tools provide this holistic view – pulling in all of your data to support cross functional views and insights.

So how does this work in practice? A great use case for BI platforms is to create easy to digest OKRs dashboards for your company, teams and individuals. Your BI platform should allow teammates from different business units pull up live views of their progress towards their outcomes / goals… anytime / anywhere… on their phones… without support from business analysis or IT.

OK, enough preamble. Here are the goldilocks (aka “just right”) criteria I look for in BI platforms:

Integrated data warehouse

Traditionally, BI tools sit on top of separate data platforms managed by engineering teams. More recently, a new class of products have emerged that allow you to upload / connect to your data without engineering support. I find this to be a huge advantage as it allows moderately-technical users to get up and running without distracting / relying on external resources. (Self service also leads to challenges with data governance but that’s another story.)

As an example, imagine easily joining together all of the spreadsheets you store in Google Drive / Dropbox with live data connections to Google Analytics / Facebook Analytics / financial data / more and then exploring and visualizing this data as you choose. That’s what these new platforms do all without the help of data engineerings resources.

Data engineering for dummies

Some of the best data scientists I’ve worked with estimate that they spend 80-90% of their time on data hygiene before they can begin analysis and exploration. The same goes for business analysts.

You will also see BI in the form of Embedded Analytics within various tools – like your CRM system or your Web Analytics platform. Generally, Embedded Analytics help steer micro tasks like, which email subject performed best?, vs. providing a holistic view of data across multiple sources. The best BI tools pull in all of your data to support cross functional views and insights.

So how does this work in practice? A great use case for BI platforms is to create easy to digest OKRs dashboards for your company, teams and individuals. Your BI platform should allow teammates to pull up a live view of their progress towards their outcomes / goals on their phones – right before they go to sleep every night!

OK, enough preamble. Here are the goldilocks (aka “just right”) criteria I look for in BI platforms:

Integrated data warehouse

Traditionally, BI tools sat on top of separate data platforms managed by IT teams. Recently, a new class of products have emerged that allow you to upload / connect to your data without engineering support. I find this to be a huge advantage as it allows semi-technical users to get up and running without distracting / relying on external parties. Self service also leads to challenges with data governance but that’s another story.

As an example, imagine easily joining together all of the spreadsheets you store in Google Drive / Dropbox with live data connections to Google Analytics / Facebook Analytics / financial data and then exploring and visualizing this data as you choose. That’s what these new platforms do all without the help of data engineerings resources.

Data engineering for dummies

Some of the best data scientists I’ve worked with estimate that they spend 80-90% of their time on data hygiene before they can begin analysis and exploration. 

https://www.forbes.com/sites/gilpress/2016/03/23/data-preparation-most-time-consuming-least-enjoyable-data-science-task-survey-says/#183675d26f63

What does that mean for BI tools? Any functionality that support easy data manipulation for the sake of improved clarity is awesome. That means – joining data together via drag and drop, changing data types with a click, deduplicating rows without writing SQL is all a huge value add, extending the range of users who can go deep with the data without external assistance.

What does that mean for BI tools? Well, any functionality that support simple data manipulation is awesome. For example – joining data together via drag and drop, changing data types with a click, deduplicating rows without writing SQL, are all huge value adds, extending the range of users who can go deep with the data without external assistance.

Live data! From the cloud! On your phone!

Data that arrives attached to an emails is DOA. This is one of my absolute pet peeves. Further, once people begin offline discussion and editing of the data, the risk of multiple inaccurate versions / views of the same data set commonplace. 

BI tools need to pull from a live backend at all times. When I pull up a link to view a dashboard the data should be (pseudo) real-time, up-to-date, and time stamped clearly with the data last run.

This also means the platform should be mobile-centric. Old timers still want their landscape printouts, but there is nothing more powerful than conversing with colleagues and pulling up live data views on your phone à la minute. 

AI / ML aware

I don’t want to overstate this one as we’re in the very earliest of innings, but your platform should have the foundation of supporting automated machine-learning driven insights. You may not find these immediately valuable (they rarely are out of the box) but in a few years you be getting voice alerts when your data spikes unpredictably in ways you may not have imagined. There is no sense in investing in a platform that is not actively working on automated data insights.

As a start, I’d like to see my platform present basic statistics around the data that I’ve on-boarded. This means simple distribution and correlation reports. As you play with these statistics you’ll be able to more easily wrap your arms around the data at hand, steering deeper analysis and insights. Simple predictive analytics is another good baby step before full blown AI.

This all said, you separately need to invest in training of your teams to take advantage of these statistical insights. Leveling up the data fluency of your team is always more valuable than standing up a wiz-bang technology solution.

Narrative & collaboration focused

A perfect platform would support for metrics-backed storytelling – and not just the sharing of pie charts. That means as a product owner, I can use a BI platform to explore a set of data and then build a coherent, sharable narrative around it. That could manifest itself as a online presentation with live data at different altitudes, supported by text, images, video and other added insights. It also means that I should be able to drawn / pin annotations within the data itself.

Further, the presentation should support active conversation around what’s being presented. Unlimited named user accounts, threaded comments, open annotations, creating next step action item , @ mentions and more are a natural fit here.

Governance gone wild

Sad to say, this is critical. Like supercritical. Like, as soon as you create your second dashboard you need extreme governance otherwise you’ll never find it again or know if the data set that powers it is up to date, approved and official. 

I’ve seen smart approaches here and they center around clear labeling of the data, its origins, similar / duplicative data and more. Having easy way to validate data as “best” or “official” helps too. Ultimately, ML/AI will be a huge help in this arena.

An integrated, dynamic “data catalog” that shows you the breadth of your data, its lineage, stamps of approval, and error reporting is also must-have.

User-level data FTW

BI tool typically play in the aggregated, anonymous altitude. You can see how all your site visitors behave, customer acquisition by location, sales by campaign, etc. Data is viewed on the content, page, campaign, location level – but rarely at user level. In a perfect world, a graph model would be deployed at the atomic event level allowing pivots at the above altitudes but also down to the user level.

A new breed of system called Customer Data Platforms is jumping into the fray here, promising a single view of the user. These CDPs are being leveraged today by Marketing and Sales team but the application of this user-level view to more typical BI use cases is immense. Perhaps CDPs are the topic of the next post in this series…

Live data! From the cloud! On your phone!

Data that arrives embedded within emails or as an excel attachment is Dead on Arrival. That is one of my absolute pet peeves. Further, once people begin to discuss and edit the data set, the risk of multiple versions / views of the same data becomes legitimized. 

BI tools need to pull from a live server at all times. When I pull up a link to view a dashboard the data should be (pseudo) real-time up to date or time stamped clearly with the data last run.

This also means the platform should be mobile-centric. Old timers still want their desktop-focused printouts, but there is nothing more powerful than conversing with colleagues and pulling out live data views on your phone à la minute. 

AI / ML aware

I don’t want to overstate this one as we’re in the very earliest of innings, but your platform should have the foundation of supporting automated machine-learning driven insights. You may not find these valuable right away (they rarely are) but in a few years you should be getting voice alerts when your data spikes unpredictably. There is not sense in investing in a platform that is ignorant to this coming trend.

To start, I’d like to see a platform present basic statistics around the data that I’ve onboarded. This means basic distribution and correlationsinformation. As you play with these basic metrics you’ll be able to more easily wrap your arms around the data at hand, informing deep analysis and insights. Simple predictive analytics is another good baby step before full blown AI.

This all said, you separately need to invest in training of your teams to take advantage of these statistical insights. Leveling up the data fluency of your team is often more worthwhile than the data platforms that they utilize.

Narrative & collaboration focused

A perfect platform would allow for metrics-backed storytelling, and not just the sharing of data dashboards. That means as a product owner, I could use a platform to explore a set of data and then build a coherent, sharable narrative around it. That could manifest itself as a online presentation with live charts (naturally) surrounded by text, images, video and other added insights. It also means that I should be able to drawn / pin annotations to the data itself.

This also means that the presentation platform should support conversation around what’s being presented. Unlimited named user accounts, threaded comments, open annotations, tasks lists, @ mentions and more are a natural fit here.

Governance gone wild

Sad to say, this is critical. Like supercritical. Like, as soon as you create your second dashboard you need this otherwise you’ll never find / know which data is most recent, best, approved and official. I’ve seen smart approaches here and they center around clear labeling of the data, it’s origins, similar / duplicative data and more. Having easy way to validate data / views as “best” or “official” helps too. Ultimately, Machine Learning will be a huge help in this arena.

An integrated, dynamic “data catalog” that shows you the breadth of your data, its lineage, validations and error reporting is also must-have.

User-level data FTW

BI tool typically play in the aggregated, anonymous altitude. You can see how all your site visitors behave, customer acquisition by location, sales by campaign, etc. Data is viewed on the content, page, campaign, location level – rarely at user level. In a perfect world, a graph model would be deployed at the atomic data layer allowing pivots by the above altitudes but also on the user level.

A new breed of system called Customer Data Platforms is jumping into the fray here, promising a single view of the user. These CDPs are being leveraged today by Marketing and Sales team but the application of this granular view to more typical BI use cases is immense. Perhaps CDPs are the topic of the next post in this series…

Get to know a few of Viacom’s data scientists

Here’s a great profile on a few of my Data Science colleagues here at Viacom. So excited to see a few of my hires (Matthew and Preeti) profiled!

Viacom has a strong track record of hiring data scientists with deep academic backgrounds who have also completed business training boot camps.  Matt and Preeti were graduates of the Insight Data Science Fellows Program – an intensive 7 week post-doctoral training fellowship bridging the gap between academia & data science.

With any new hire, there is a learning curve.  The transition can go smoothly if there are mentorship opportunities and other senior data scientists in place before the new cadets arrive.

Selecting what to work on is often more important than the work.

I’ve recently taken on a new role at Viacom as corporate vice president of data strategy.  Here, I sit within a small group of ‘data mercenaries’ looking across the org looking for opportunity to scale how we work with data science and data platforms.  It’s an fun pivot from past roles leading and building teams, and the opportunity seems enormous.  In addition to taking on specific data projects / products, we’re asked to look across ALL of Viacom’s data efforts and assets and help everyone do more.

Our first step is to install a new process for defining the work each data group takes on.  The benefits of this pre-work are multifold and tremendous.  We now have a shared methodology for documenting the goals, expectations and ROI for each project – leveling the playing field for each team to get the understanding, buy-in and support they need.  Here’s a peek into our process:

  1. Problem Statement – a single S.M.A.R.T. sentence that clearly defines the scope of the work at hand, the expected outcome metrics and the timeframe for delivery.  Getting this right and agreed upon can take days.
  2. Context – the landscape and rationale why we’re taking this project on.
  3. Success Criteria – measurable KPIs that will allow us to prove the projects value.  The project shouldn’t move forward without these.
  4. Scope – where do we start, what do we leave out (for now).
  5. Decision Makers – who’s the boss.
  6. Stakeholders – following a RACI approach, who ultimately owns the projects (Accountable), who’s supports this person (Responsible), who’s been Consulted and who’s been Informed.
  7. Constraints – what movable / immovable roadblocks have we identified before taking on the project?

We boil the above into a single page that can shared broadly across the org so that everyone from our most senior managers to the most junior data engineer know what we’re shooting for and what we’ll be measured against.  This also allows us to look across projects and determine where best to spend our resources.

It’s early days, and we’re always learning how to improve the quality of our process estimates, but this big organization just got a little bit more aligned and folks are excited by the newly created clarity.

Using data science to find the right influencers for specific social moments.

It’s been a busy inaugural year for Viacom’s Social  Data Strategy team.  We were founded last Fall with the mission of using advanced analytics and data science to support the growth of revenues from Viacom’s massive social footprint of about a billion fans.  I’m proud to say that we’re well on our way.

One of the first new tools we’ve released is the Social Talent Platform (STP), a data driven, fit-assessment platform that helps our social casting teams identify the best social talent for a particular campaign.  There are a number of great data sets in the market that follow and classify social talent, but none of them can tell you how good a specific influencer might be for a specific project – especially integrated marketing projects that include both internal Viacom content and external advertisers.  Sensing this gap in the market, and knowing that our content teams and advertisers want both art + science to inform their decision making, we created a proprietary platform or unique data sets, algorithms and visualizations.

We followed the standard data product blueprint:

Data Acquisition > Data Management > Data Modeling > Data Storytelling


  1. Data Acquisition.  Here we partnered with the best social influencer data companies, social listening data companies and machine learning toolsets in the business.  As many of our deals included custom features, vendor selection and deal structure required pure-play business development and product strategy chops.  For the STP we also leveraged unique data sets that are not typically consider when searching for social talent.   The ingredients make the dish!
  2. Data Management. We connected our data together using licensed data aggregation platforms and custom data environments.  In addition to building a custom database of social talent entities, we also built social profiles for content and advertisers.  Mapping together entities from within disparate data sets was a challenge here, as it is in most data efforts.
  3. Data Modeling.  Two PHD data scientists on my team built proprietary algorithms to compare these entities – influencer, content, advertiser – together to find the perfect fit for each use case.  We looked across the dimensions of audience demographics, topic overlay, post emotionality and more.  We consider non-social data in our models used time series data to predict increased future engagement.
  4. Data Storytelling.  We built a custom front end JavaScript application to allow our talent, content and advertisers to see the results of our custom search tool.   At a creative company like Viacom, outcomes presented via spreadsheets just doesn’t cut it.  This is one of my favorite parts of the project as it pulls on all of my past experience in traditional application development.

The result is a patent-pending, bespoke data platform that helps create more engaging social content.  Kudos to the entire team on this one!

The dark ages of tech usability.

The future is bright my friends.

Our kids will laugh at photos of subway cars, packed with hunch-backed phone swipers.  They’ll mock our cable / dongle filled existence.  They’ll pity the eye strain and radiated pockets that we burden ourselves with to ensure we don’t miss a single Instagram live story…

The original “wireless”

At least I’d like to believe the future is bright.

There are serious challenges ahead for technology and mankind in general, but there is a version where technology integrates seamlessly into our daily lives and we all become more human again.  This version of the future sits next to visions of unlimited clean energy, desalinated water for all, repopulation of the earth’s lost species and the Mets gaining respectability again.

Google Glass 1.0 was a hot mess, but the ergonomics of posture-friendly wearables was on the right track.  I greatly look forward to friends and strangers looking each other in the eyes again as we pass on our way to our driverless rides home.

First data, then vibe: How Viacom casts influencers in 90 percent of its campaigns.

Reposted from: https://digiday.com/sponsored/viacombcs1-008-first-data-then-vibe-how-viacom-casts-influencers-in-90-percent-of-its-campaigns/

At first glance, there’s little that sets Shaun McBride—a charismatic former skateboarder who goes by the handle “Shonduras”—apart from the millions of other social media influencers enjoying the spoils of Internet fame. But in March, Viacom’s brand studio, Velocity, anointed McBride as a creative consultant, a move based largely on his Snapchat success.

McBride is among the many influencers the unit works with, mainly on campaigns, in a given year. His prominence shows how seriously Viacom takes its digital talent strategy: Velocity uses social media influencers in 90 percent of its campaigns, an approach that has evolved over years.

“A few years ago—the good old days—we could’ve put up a social post on certain platforms on behalf of an advertiser in the hopes of getting perhaps over 50 percent of those people to actually see it organically,” said Lydia Daly, SVP of Social Media and Branded Content Strategy for Viacom Velocity. “Now it could be as little as less than five percent meaning our distribution tactics have had to evolve.”

Influencers have become a cornerstone of the unit’s distribution strategy. And while McBride puts up big numbers on Snapchat and YouTube, Daly said much more goes into the casting of influencer partners than a sizeable following. To select the perfect influencer partner, Daly deploys a five-person team that combines old-school Hollywood casting techniques with new-fangled data science.

Part one: The reach

Of course, the numbers come first. “You’re looking at the numbers,” said Daly “and that helps you to whittle down from hundreds of thousands of potential influencers in the world to the 20 or so that might make sense for the campaign and make it onto our final talent proposal list.”

Those numbers go beyond cumulative subscriber counts to include average video views, breakdown of sponsored video views versus non-sponsored video views, growth trajectory over time, audience demographics, even the engagement metrics that indicate an influencer’s active subscriber base. Viacom guarantee campaign performance, so the Velocity brand studio is just as invested in accurately calculating a social influencer’s real reach as the brands that question the tactic’s value.

“You want active fans who are likely to remain active for a particular campaign,” said David Berzin, VP of data strategy, who leads a team of data scientists, including one doctor of mathematics and neuroscience, that collects and interprets influencers’ value. “The follower count is a lifetime number which is not necessarily relevant for a campaign you’re planning for next month.”

Then there’s the audience itself. “We have ways of looking deeply at the talent’s audience to find if it’s a good fit,” said Berzin. In some cases, Viacom looks for a perfect reflection of an audience they already have, say MTV’s core viewership. For other campaigns, they’re looking for a way to extend their reach into a new niche audience.

But in all cases, the numbers are just the beginning. “We don’t try to be prescriptive with the data.”

Part two: The vibe

Once the numbers are tallied, it’s up to Daly’s social talent casting and management team to work the talent. Here, casting relies—as it always has—on keeping up with trends in the marketplace and close relationships with talent agencies and managers. The team keeps a few different wish lists of talent: “interesting influencers in certain categories, those that fit well with Viacom’s brands and ones that are on our radar… that [are] kind of at a weird tipping point.”

And, of course, there’s chemistry. Daly’s team takes the lead, looking for charisma and personal spark while disqualifying influencers based on a client’s red flags: “There are certain clients that are extremely conservative—they would not want an influencer who has ever sworn in a video,” Daly said. Although that hasn’t stopped her talent team from passionately making the case to clients for creators they have faith in.

But even in evaluating personal chemistry, the data team plays a role. “We have a patent pending social data analysis tool that examines the fit between an advertiser, a content property and social talent,” Brezin said. “Consider it a set of customized set of ranked Venn diagrams that we create for each of our campaigns.” The data team will examine what kind of content the advertiser’s preferred audience watches along with traditional data like demographics.

Then there’s emotionality. Using natural language processing, the team can extract words and phrases and “bucket them into certain emotions. That basic fingerprint of emotionality gives you a good sense of how that audience typically reacts, and might react,” to a particular content strategy.

Part three: The relevance

The perfect influencer, according to Berzin and Daly, isn’t necessarily someone big, but someone who’s about to be big. “You really want to look for ebbs and flows, and talent that’s about to peak as opposed to an inflated follower count,” Berzin said. But Viacom is also looking for someone who’s relevant.

For Trojan’s campaign at last year’s MTV awards—designed to get millennials to wear condoms—the team wanted to propose Shannon Boodram, a YouTube sexologist at the top of their wish list. Though she didn’t have the tremendous follower count that advertisers crave, her sex-positive social presence was a perfect match for the campaign. And she seemed to be at a tipping point.

To help bolster her reach, they paired her with a comedic heartthrob,Josh Levya, said Daly. His 2 million strong subscriber base ensured Boodram’s on-brand message for Trojan cut through the social noise. The campaign for Trojan culminated in an appearance by Boodram and Leyva on the red carpet at Viacom’s MTV Video Music Awards–with Boodram wearing a dress of her own design made from Trojan condoms, naturally. The pairing resulted in an avalanche of positive press for Trojan and Boodram.

“It just speaks to how Viacom can elevate the brand of the talent.” said Berzin, “It’s a two-way street.”

The Ultimate Influencer?

Velocity has garnered some ink for its deal with influencer-turned-consultant McBride, aka Shonduras. While it might seem like Viacom’s just hedging its bets by going with the Snapchat flavor of the month, it instead found in him a kind of ideal influencer: one with the right reach, vibe, authenticity, adaptability  and business savvy to be more than another distribution channel.

“There are some influencers who post content to social media that goes viral, then accidentally become famous and start doing branded content deals,” said Daly. “Shaun is not one of those.”

He’s a motivated businessman, interested not just in how to build his own platform success, but in the interplay of content between platforms. His experiments with content formats, actively tracks trending content and is tireless when it comes to engaging directly with his fans, all of which pays off handsomely in brainstorms.

“In Shaun, and other creators, we are always looking for people who can craft stories across platforms,” said Dr. Thomas De Napoli, Velocity’s senior director of content and platform strategy. “That’s what our studio aims to do, and Shaun makes sure we’re doing it in a way that means something to fans.”

Shaun has already made major contributions to creative strategy sessions both on the brand and channel side of Viacom and is increasingly becoming an in-demand contributor for such meetings.

And, according to Berzin, McBride is, in addition to a content creator, a born metrics geek. “We have data teams that crunch numbers all day, but he just observes the numbers and his insights are often directly in line with our prioritized metrics.  And, he has a unique point of view as a social talent that…is just invaluable to us.”

But, as Viacom has found time and time again, the ultimate influencers may not be the folks with the biggest Snapchat following, the most liked Facebook posts, or the most fire Tweets. The ultimate influencer is situational, empowered as much by timing and authenticity as by the brute force of numeric popularity.

About Steve Jobs

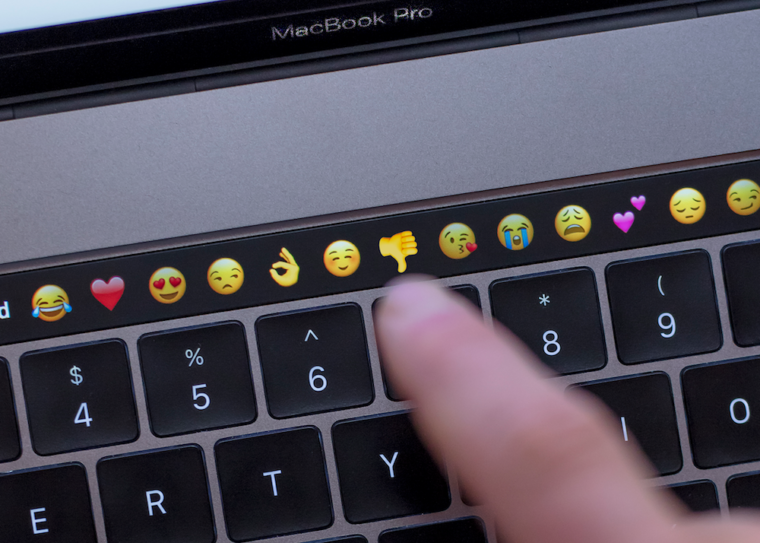
I stopped by the new Apple store in Williamsburg Brooklyn today in search of answers.  First up was the quest for new large format display to plug my laptop in to when I’m fixed at home and need the extra space.  “We no longer sell them.  Here’s an LG display; this one’s great cause it has built in speakers”.  Then I checked out the new 15″ laptops, as large format wins since working ergonomics beat carrying ergonomics (?), “This one has an y processor, but ram is capped at y and costs x”, “This one costs 2x and is the right call”.  I asked why pick the more expensive one, and I believe the answers included better trackpad, speaker positions and a non-mobile processor.   Meanwhile, my latest iPhone crapped out and required a reboot.


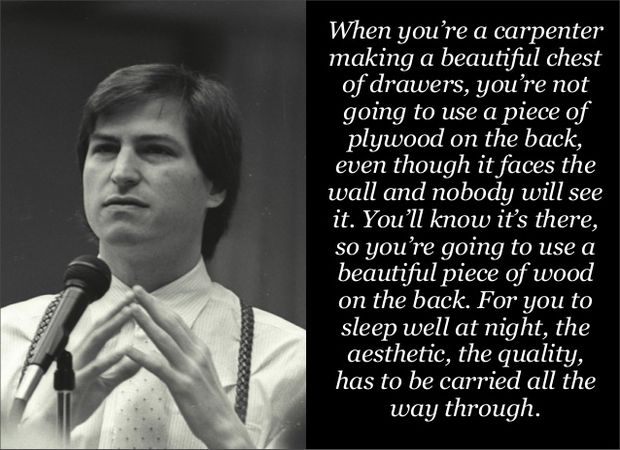
About Steve Jobs.  This guy, from the little I’ve read – which does not include any official or unofficial biographies – was a maniac.  Criticism should start with his disregard for the human condition of his workers, then perhaps move to the heavy metals used in his manufacturing (yes, Apple’s push towards recyclability and other efforts were better than most).  But let’s focus on his management style – brutal, dominating, Amazon-esque and such.

All disclaimed, a question surfaces — was this a golden age for product?  Shit just worked and it was elegant as fuck.  Of course, my new phone takes photos with a gazillion more megapixels, but it does crash more than the dickens.  I can’t open my current iPhone without “Voice Assist” (I see you Siri) offering it’s mind-numbing help.  I can’t dock my laptop into my display without creating massive confusion during the next video conference.  The list goes on, but it all circles back to Steve.


Does a product owner need to be maniacal to be effective?  Did Steve need to be a dick to be great?  Did jr. developers and sr. accounts needs to be rolled under his tires for my iPhone to simply work properly when I asked it to?

My oldest friend worked in the kitchens of some of the world’s best restaurants, and commented that the culture there was abusive and awful.  I do not condone any of that, honestly, but I do recognize the context of ‘worlds best’.  Do 20 unhappy campers – who get to list Noma or Apple on their resume – undo the experience of thousands or hundred of millions of impressed customers?  Whats the balance?

Hard to say.  I’m now open to shop for non-Apple products, but I’m fairly sure the options are meh.

Social media & measuring where fans will go next.

David Berzin, Vice President, Social Data Strategy at Viacom Talks About Staying in Step with the Social Media Landscape

Reposted from http://v.viacom.com/social-media-measuring-where-fans-will-go-echo/

David Berzin HeadshotV by Viacom: As marketers, how should we be thinking of social media right now?

David Berzin: We’re solving for two variables, really. We’re not just building out branded campaigns and monitoring fan response in the present – we’re also using the data we collect now to help us predict fan response in the future.

V: But social media can be extremely fickle. Is that a good or a bad thing for brands?

DB: I think it’s a good thing because it pushes us to work harder. With the evolving media landscape and its increasing audience and platform fragmentation, changing content consumption habits and new technologies have created challenges for the entire industry.  But that evolution has also created a host of new opportunities that continue to help us break new ground.

V: So what does that evolution look like in terms of social platforms and shifting behaviors in audiences?

DB: Well, considering we have the youngest demos of any major television company, we need to be nimble. Then add in the fact that 20 percent of all Millennials are now mobile-only, the growth of live social video and the impact Snapchat is having on the entertainment industry, and you begin to see all these layered nuances.

We know marketers want to reach their fans beyond linear with a scale and breadth of touch points. Our Echo campaigns do just that. To compliment that, we recently launched 3.0 version of the Echo Social Graph (ESG) – our proprietary cross-social measurement tool that helps marketers capture the true reach of our social-by-design campaigns.

The goal is to capture more social platforms than ever before with new insights on emotion, audience and social talent.  ESG data also feeds in to our campaign design and projection toolsets, giving our creative teams data-driven insights to really help inform their artistic decisions.

V: What are you trying to capture beyond page views and interactions?

DB: (laughs) Pretty much as wide and deep as you can get. The Echo Social Graph is a constantly evolving platform that, at its core, reaches outside of the traditional television footprint.  It’s a measurement of social that more accurately reflects how our fans interact with our content.  Think about it – traditionally, marketers have been limited to transacting on sampled Nielsen ratings that measure TV campaigns in isolation, without really seeing their extended reach and impact across emerging platforms.  And when you’re working with social data, where platforms emerge and evolve at lightning speed, flexibility is key. The ESG is basically able to capture all of the new interactions so that all of our fans’ snaps, loops, dubs and lip sync videos are measured.

V: That’s a lot of data – how do you derive real meaning from that?

DB:  Well, here’s a perfect example. We just did a campaign with Trojan for the 2016 MTV VMA Awards that focused on normalizing the idea of condom use. Snapchat proved to be a huge win for us – we ended up more than doubling the impressions we anticipated delivering. That’s a great key learning about where our most engaged audiences are and how Snapchat is an integral partner for live programming and branded content.

V: Do you have a sense of what marketers are asking for next?

DB: More and more, they’re really interested in identifying social influencers. It’s all about finding a good fit between talent, our advertisers and our brands.  That’s why we developed a Social Talent Search platform that we use to leverage the data on top-tier and long-tail social influencers, as well as calculated metrics that allow our casting teams at Viacom to find the perfect talent for each campaign.

V: Is there one thing you’d like to measure that nobody’s attempted yet?

DB: I’d love to dig a lot deeper into the measurement of intra-network referrals within social media networks.  For example, what actions drove users to follow, share or otherwise engage with our content on social media.  We have some visibility into this for paid campaigns, but not enough for organic activities. It’s these kind of challenges that make us constantly think about “what’s next” vs. “what’s been done before.”